Identify critical factors for P&L change over time
Identify root causes in P&L and make better decisions, faster. Gain a clear understanding of P&L movement by drilling down to the individual transaction level. Spot inaccurate assumptions affecting future trading decisions and measure the performances of traders, books, and business units.
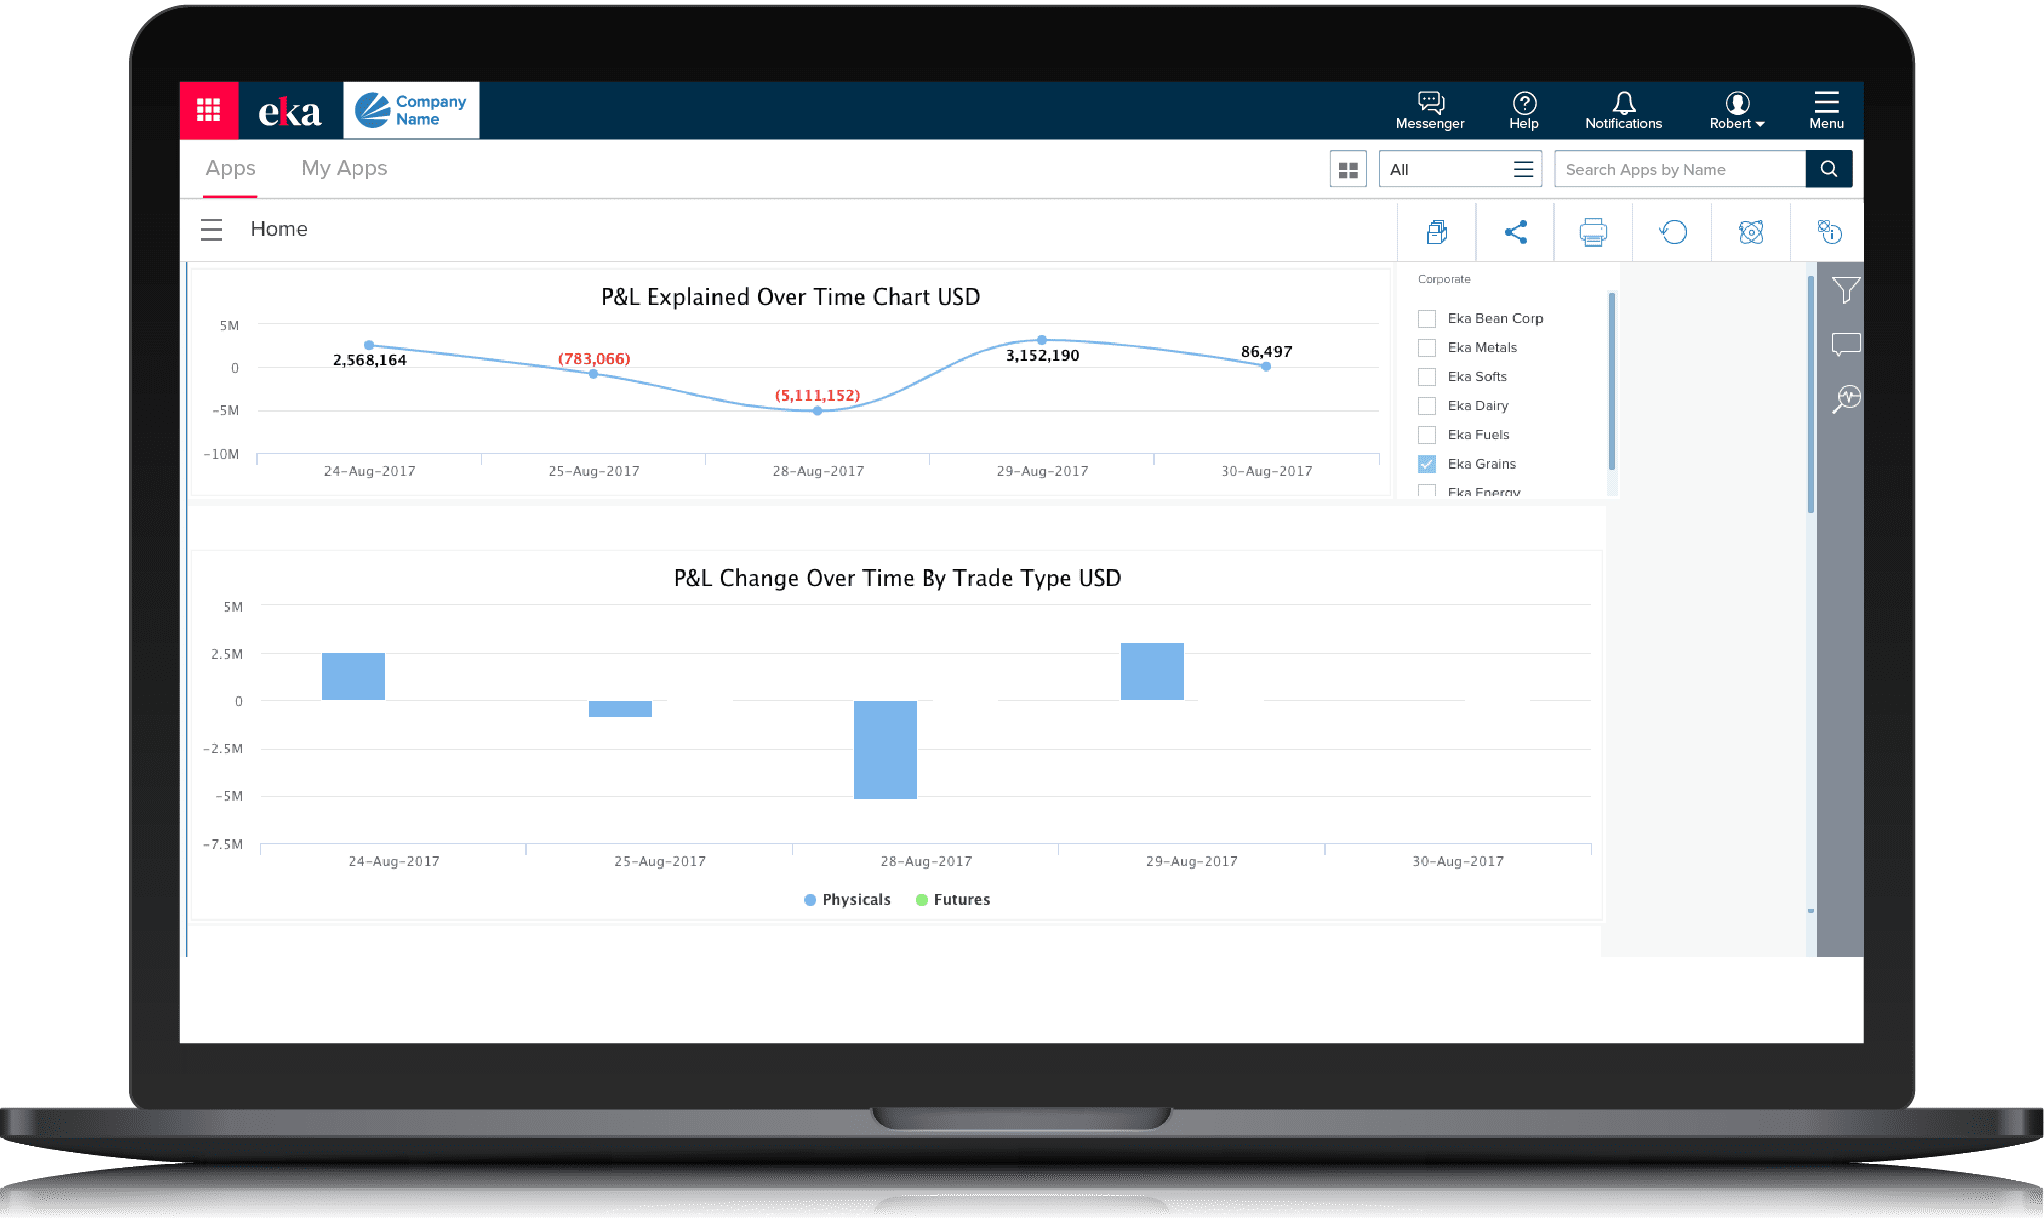
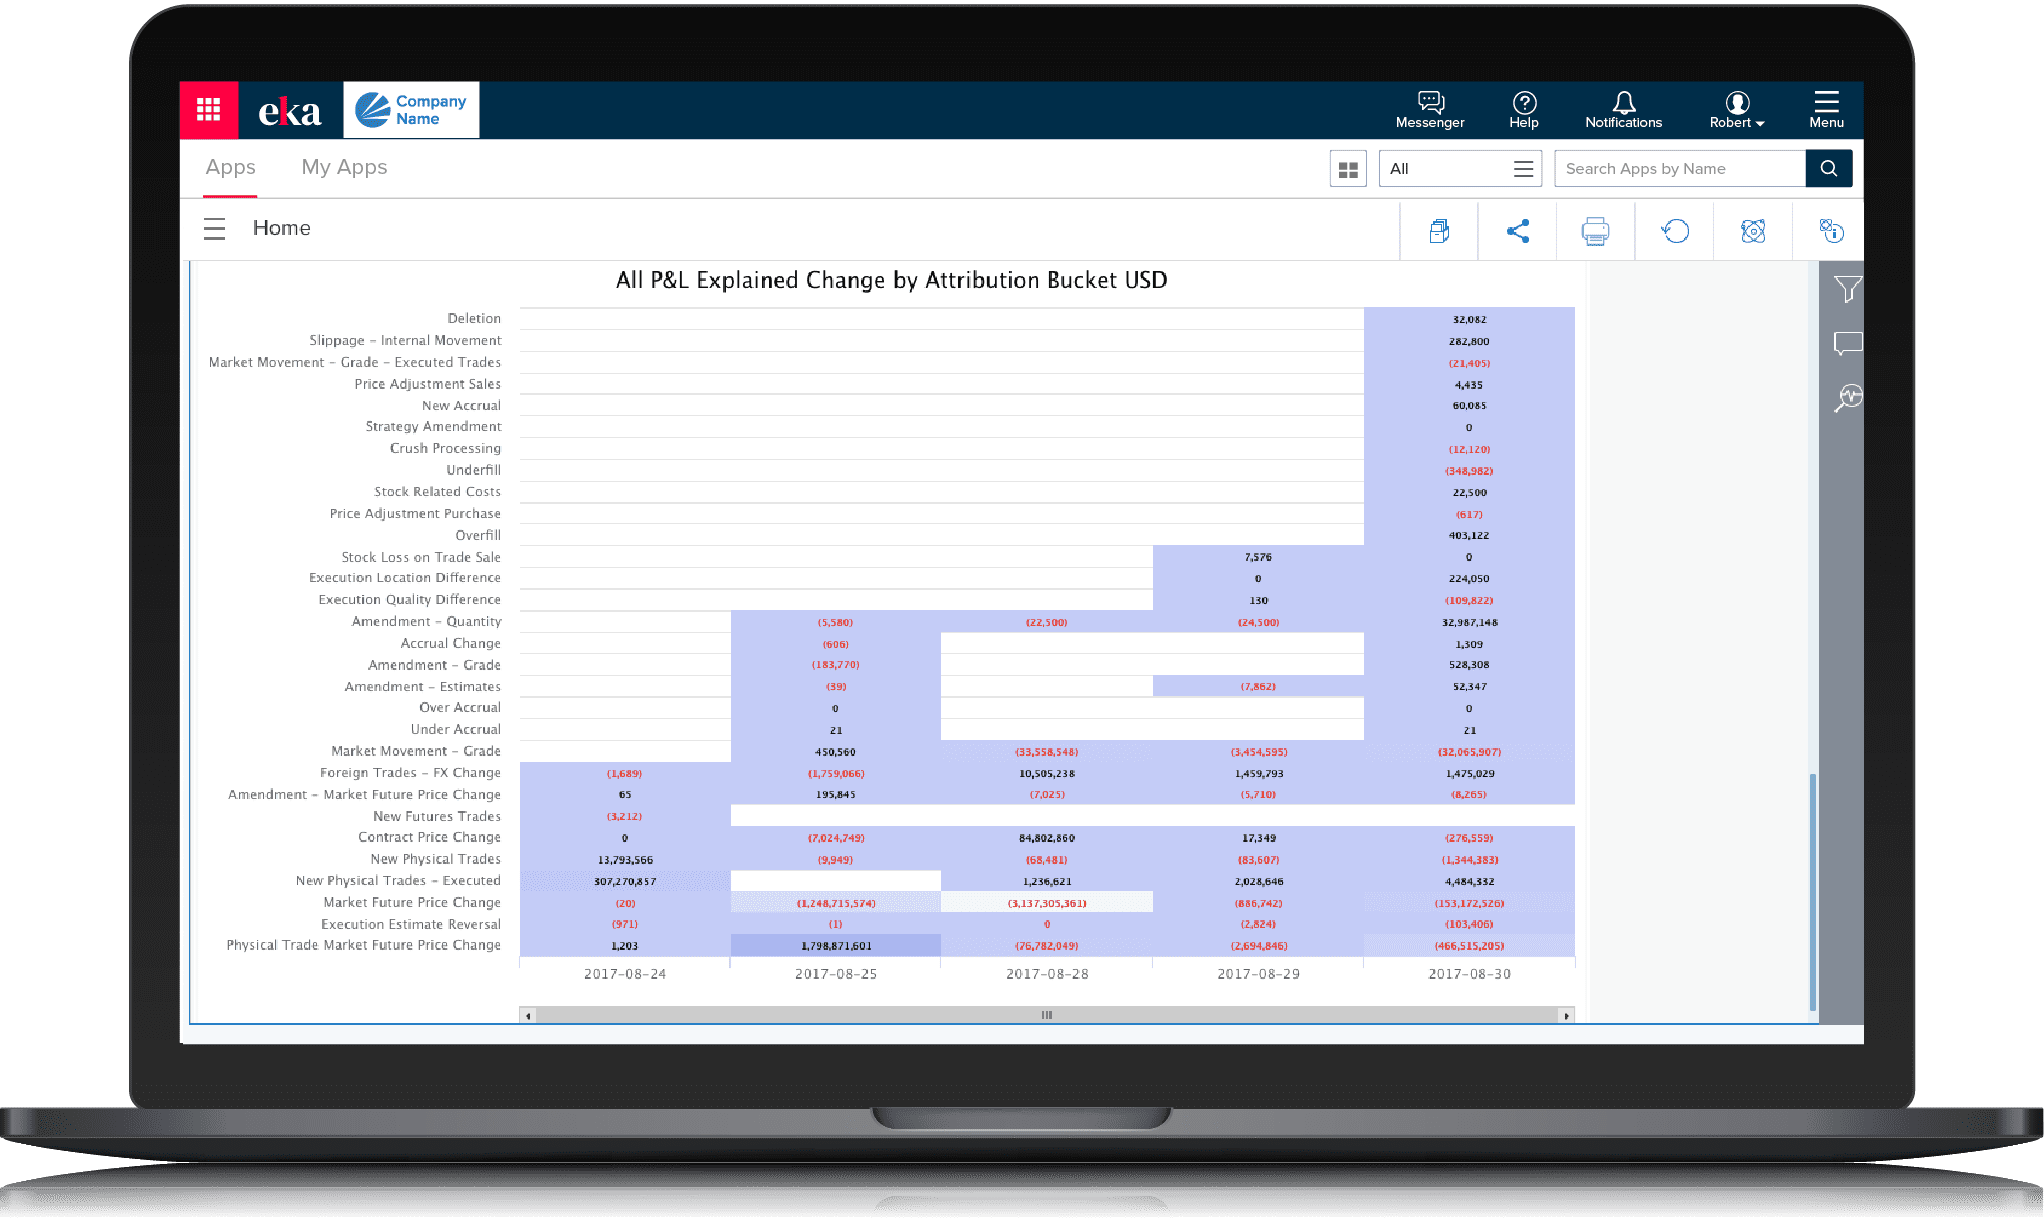
Compare P&L change over time while identifying causes for change. Allocate P&L into more than 50 attribution buckets with less than 5% P&L in residual.
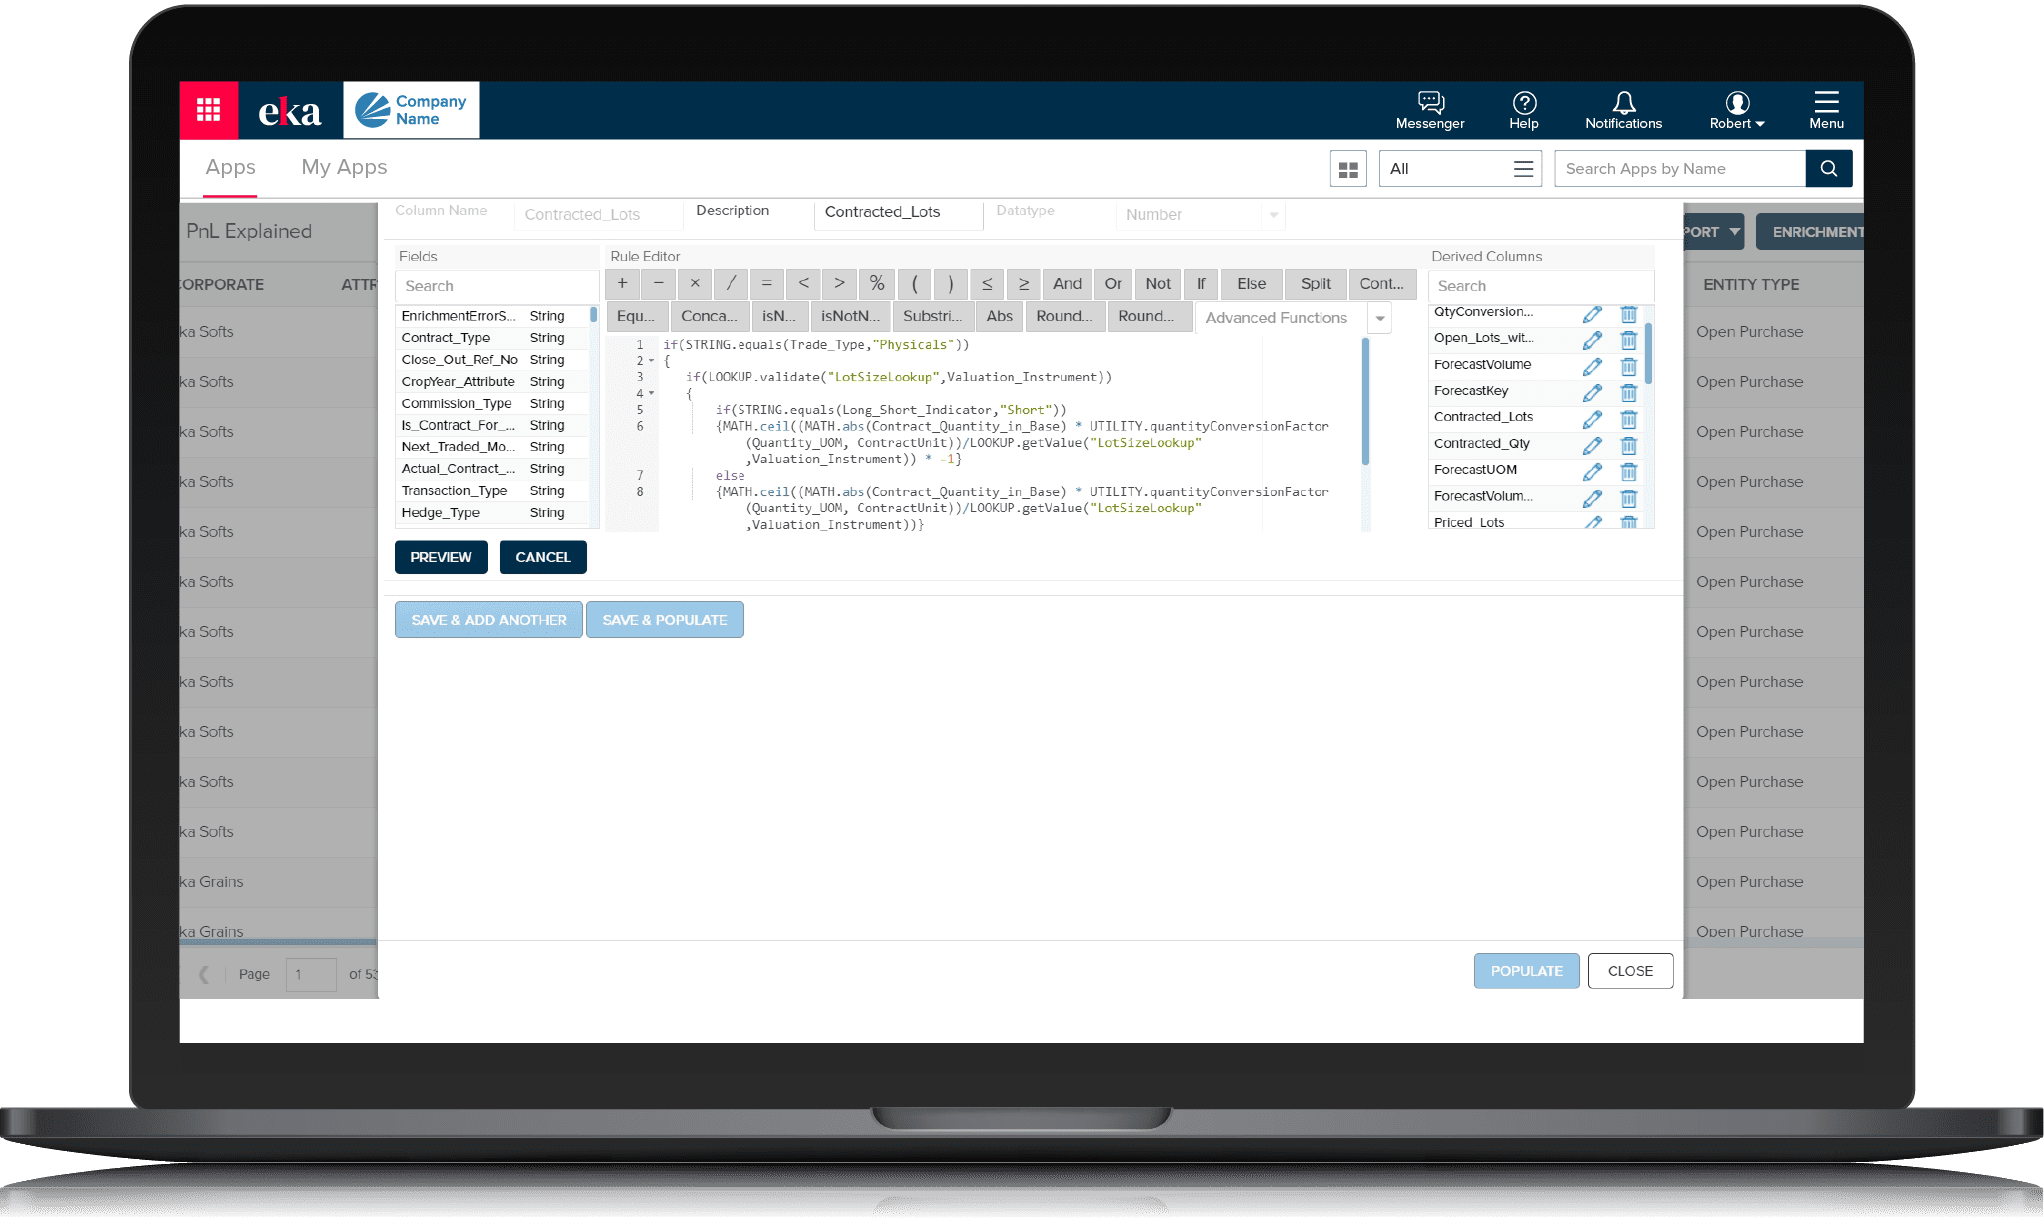
Apply complex calculations to compute changes from open, to execution, to realization. Recalculate P&L for realized buckets to explain the change from open to executed buckets. Reduce P&L attribution time from days to hours.
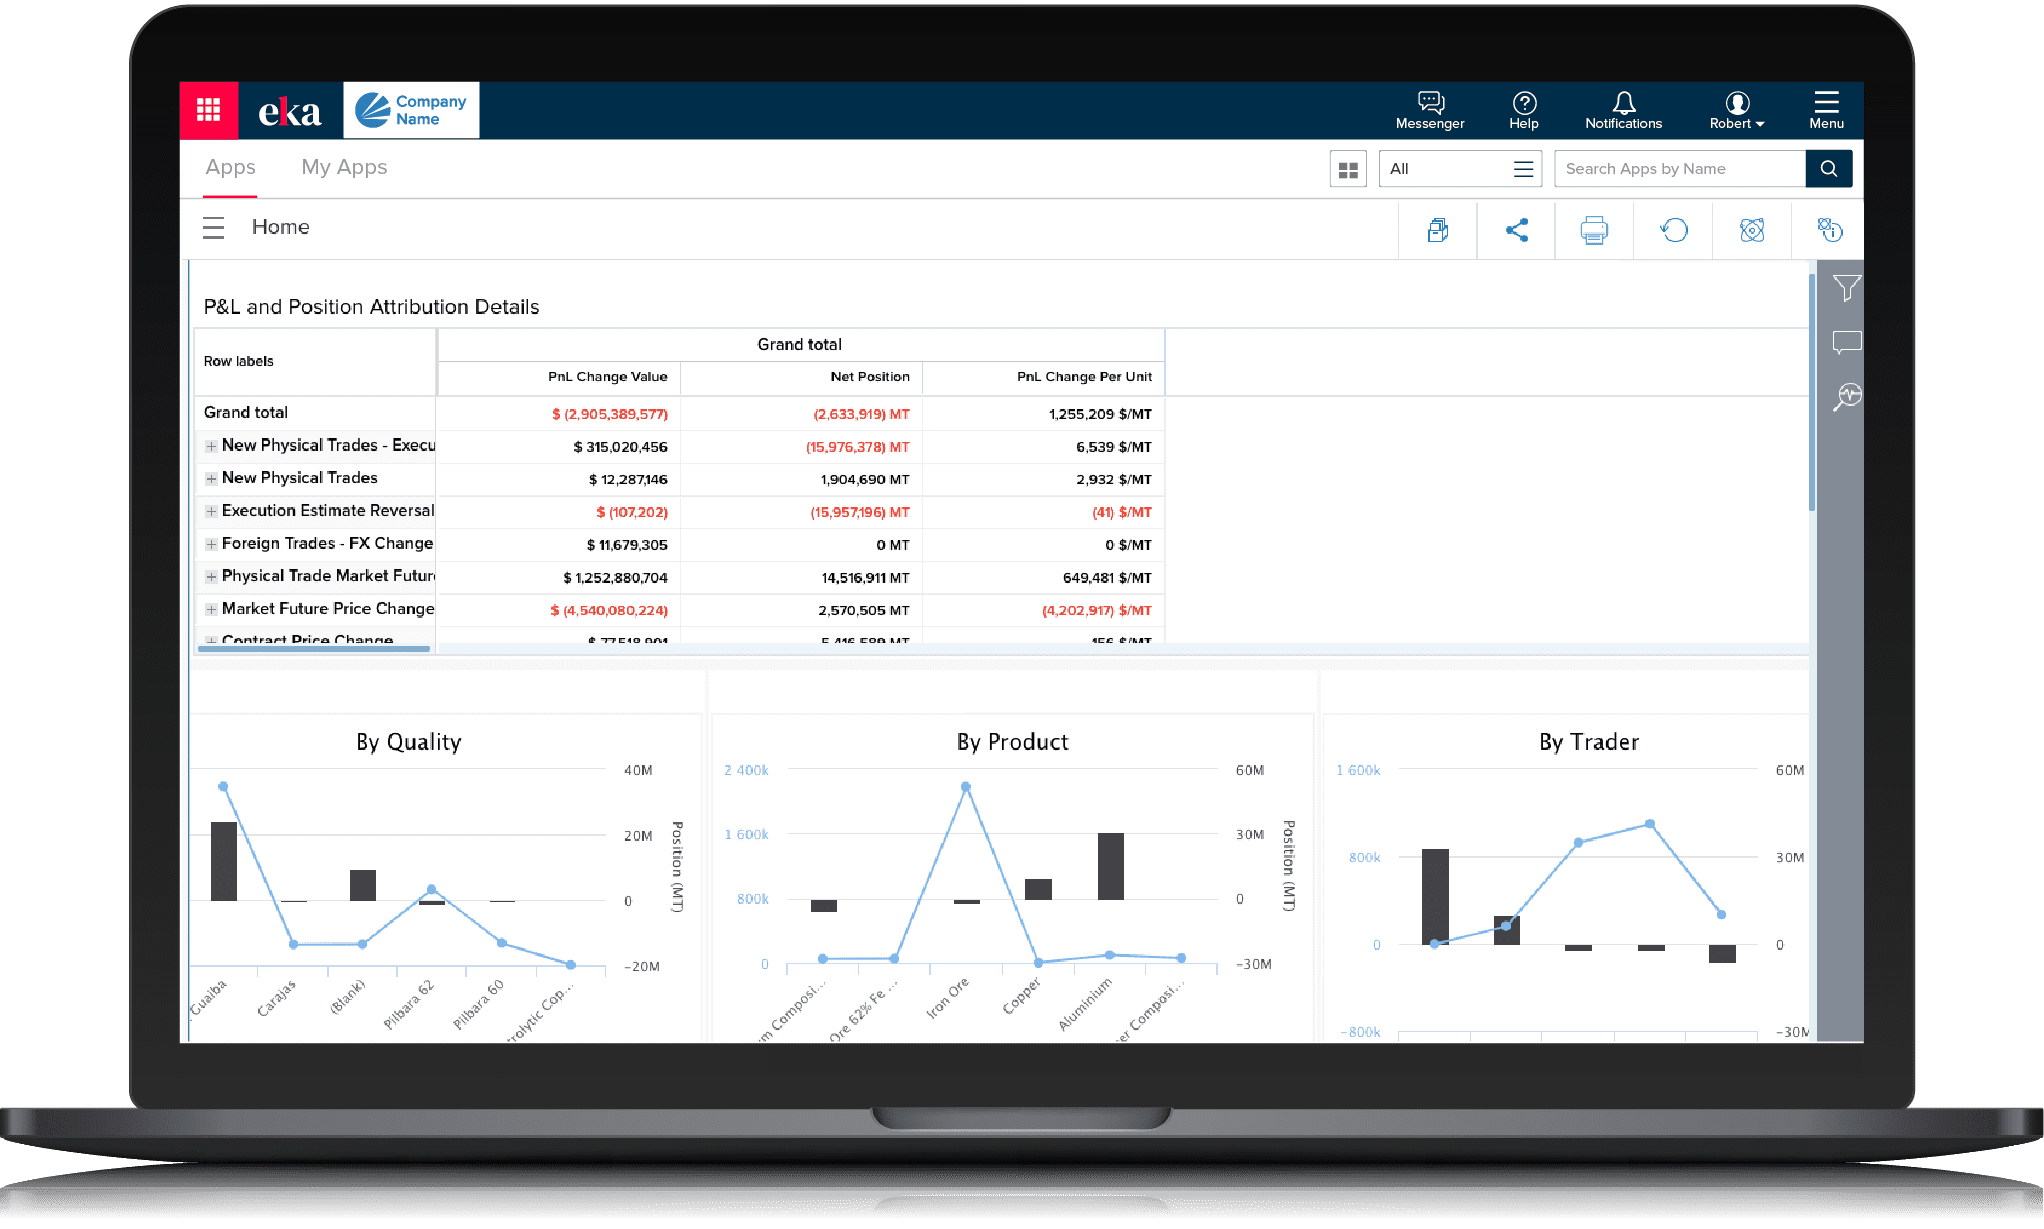
Identify trades, products and counterparties resulting in the highest P&L change. Make timely decisions around position sizes and direction based on day to day trends.
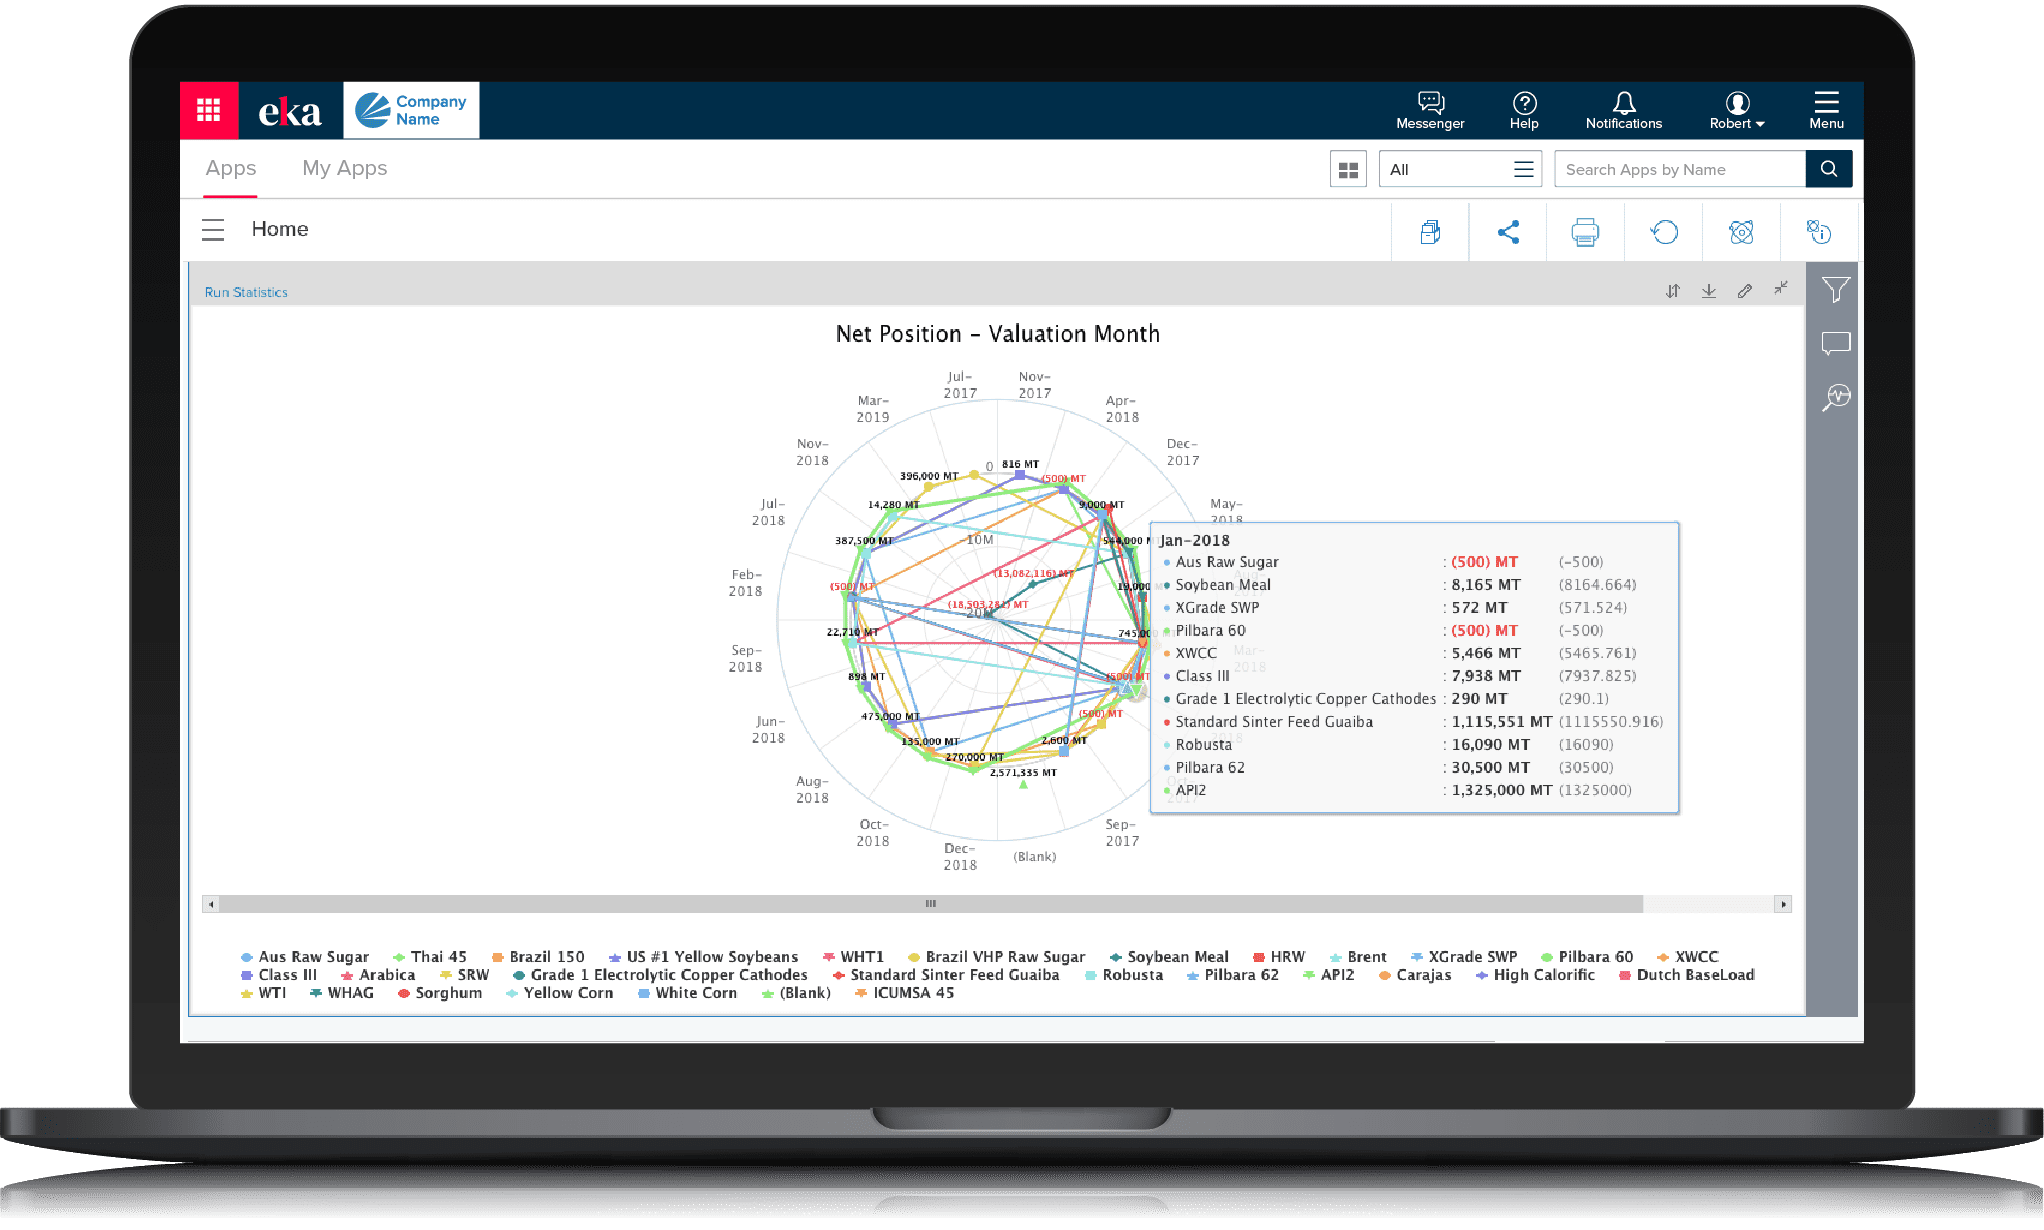
View and attribute changes in position and root cause changes at any entity level, in multiple commodities across different markets over time.
Analyze historical data to spot outliers causing P&L to change. Evaluate internal and external factors and view P&L buckets with drill down to trade level.
Compare P&L change over time while identifying causes for change. Allocate P&L into more than 50 attribution buckets with less than 5% P&L in residual.
Apply complex calculations to compute changes from open, to execution, to realization. Recalculate P&L for realized buckets to explain the change from open to executed buckets. Reduce P&L attribution time from days to hours.
Identify trades, products and counterparties resulting in the highest P&L change. Make timely decisions around position sizes and direction based on day to day trends.
View and attribute changes in position and root cause changes at any entity level, in multiple commodities across different markets over time.
Analyze historical data to spot outliers causing P&L to change. Evaluate internal and external factors and view P&L buckets with drill down to trade level.


Trusted by 100+ global businesses


Achieve better business outcomes

Freight exposure
Hedge accurately and effectively with Freight exposure app. Companies need to analyze freight to ensure both quantity and pricing are managed with constantly changing data to evaluate.

Global agricultural company gains better visibility into P&L position with Eka
A leading global agricultural company was struggling to accurately predict the changes in its P&L position. Eka’s analytics app helped them aggregate and analyze data from disparate systems automatically, without user-intensive manual processes.